Introduction
Writing is one of the 4 IELTS test skills that has two parts. For many participants, Academic Writing Task 1 is one of the most challenging and worrying test parts. But don’t be scared. Fortunately, there are several ways to improve your writing level, and you can increase your score with practice and concentration. But first, we need to know what is IELTS writing and what are its parts? So stay with us, and let’s go.
What you read in this article:
Introducing Academic Writing Task 1
Identify charts
Body paragraph
important points
Conclusion
Introducing to Academic Writing Task 1

In the IELTS writing section, you must answer two tasks. Task 1 is different in general and academic modules, but task two is similar in both tests. In Task 1 of the General IELTS test, you must write a letter, but Task 1 of the academic IELTS test includes a chart and table to summarize and paraphrase the data report in 4 paragraphs. This text will elaborate on task 1 of academic writing. IELTS Writing Task 1 Academic requires you to write at least 150 words in response to a graph, table, chart, or process. You will be presented with factual information and asked to select and report the main features of the data in under 20 minutes.
Identify Academic Writing Task 1 Charts
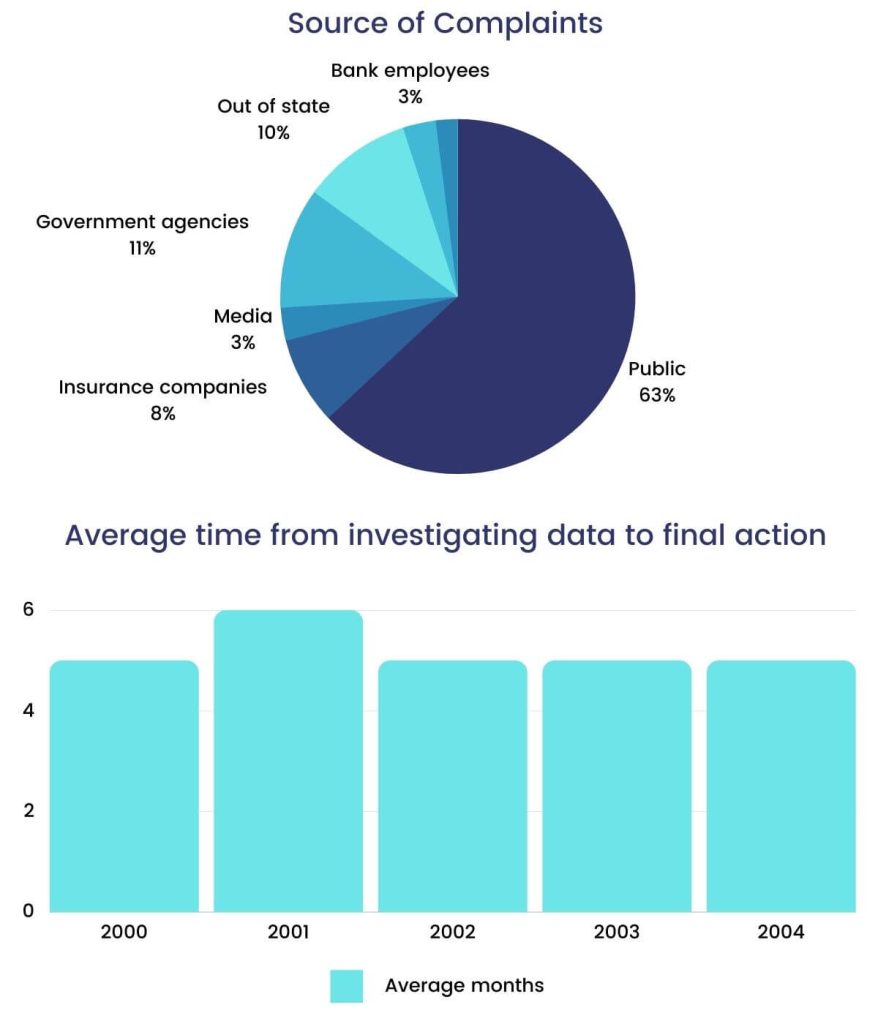
Academic Task 1 diagrams are divided into three categories. The first division includes Graphs, Charts, and Tables. Consider the following example:

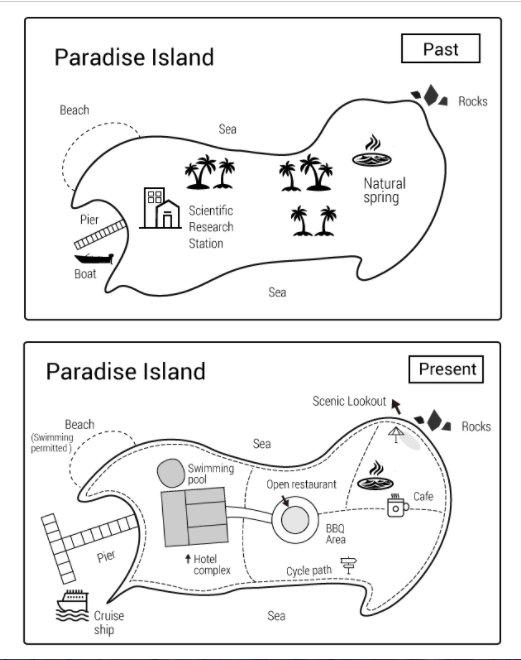
The second category includes the map, in which changes in a map over time are examined, or two maps are compared.

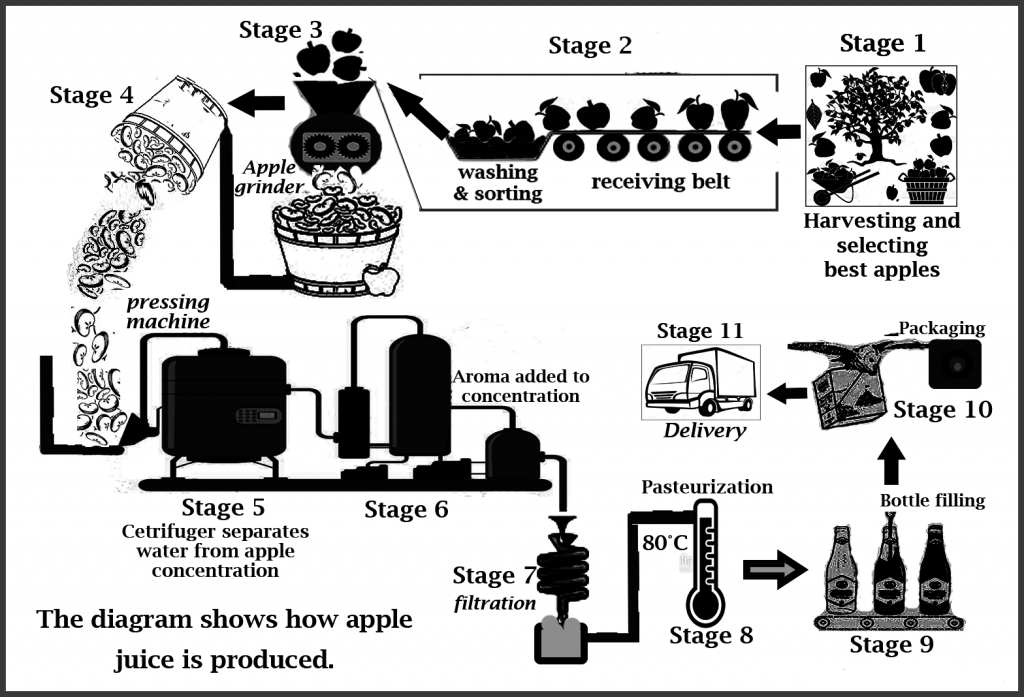
In the third category, called Processes, you need to describe the steps from start to end.

Body paragraph Academic Writing Task 1
In Academic Writing Task 1, you usually have to write a report on the question in 4 paragraphs. In writing a paragraph, you should compare the items in the chart and describe the trend of each variable over time.
Introduction paragraph
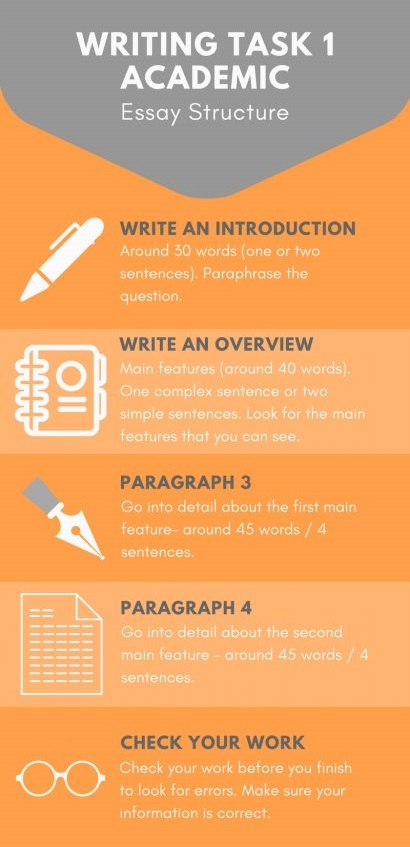
In the Introduction paragraph, you need to write 2 to 3 sentences and a general explanation of the question diagram. In other words, paraphrase the description of the graph. You can also report information about charts such as percentages, numbers, and categories.
Overview paragraph
This paragraph is essential, and the way it is written has a significant impact on the examiner’s scoring. To report this paragraph, you must carefully analyze the chart and write about the key features and general trend charts. In other words, analyze the data carefully and explain their process.
Body paragraph 1 and details
The third paragraph is about the details of the diagrams. In this paragraph, you will write about charts related to each other and compare, but more detail with numbers and percentages.
Body paragraph 2
In this paragraph, you should write other details about key features and analyze them carefully.
Finally, you can write a summary to get a higher score. In this paragraph, you should summarize the chart in one or two sentences, like in the overview paragraph.

important points
- Note that in Academic Writing Task 1, you are a reporter and must report the information provided by the question within 20 minutes. Your personal opinion has no effect, and you should not talk about it. You have to write everything you see in the question.
- In the Overview paragraph, you should explain the general trend of the table or chart. That means you have to describe an overview of the chart, and you should never use numbers and percentages in this section. Should only mention numbers in the body paragraph section. It is essential for the examiner, and you may lose your grade if you do not follow it.
Conclusion
As mentioned above, Academic Writing Task 1 is about charts, graphs, and tables. So to succeed in this part of the test and get a good score, you have to practice and expand your vocabulary knowledge. With enough practice and analysis of previous IELTS tests, you should easily find and report a logical connection between the information and the data in question.

